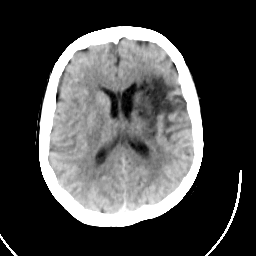
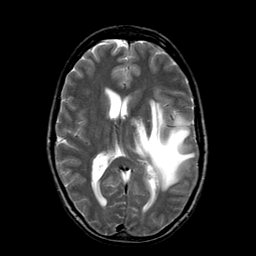
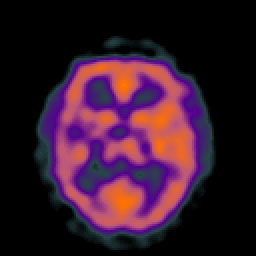
Tome is Greek for slice. The standard slice orientation in most brain imaging is transaxial or "axial". Left is shown at right. Note that, like the "lower organs", we look up to the brain. Other standard planes of view are coronal and sagittal. Non-tomographic images represent "projections" from a single point of view and include bolus contrast x-ray angiograms and MR angiograms.
Tomographic images are made up of little squares called "pixels" (picture elements), each of which takes a grey-scale value from 1 (black) to 256 (white). Each pixel represents brain tissue which is about 1 mm. on each of two sides. The thickness of the slice is often 3 or 5 mm, thus creating a three-dimensional volume element, or "voxel", which is shaped like a shoe box. Pixel intensity represents an average from tissue within the voxel.
-
CT (roentgen-ray computed tomography) A beam of x-rays is shot straight through the brain. As it comes out the other side, the beam is blunted slightly because it has hit dense living tissues on the way through. Blunting or "attenuation" of the x-ray comes from the density of the tissue encountered along the way. Very dense tissue like bone blocks lots of x-rays; grey matter blocks some and fluid even less. X-ray detectors positioned around the circumference of the scanner collect attenuation readings from multiple angles. A computerized algorithm reconstructs an image of each slice.

- MRI (magnetic resonance imaging) When protons (here brain protons) are placed in a magnetic field, they become capable of receiving and then transmitting electromagnetic energy. The strength of the transmitted energy is proportional to the number of protons in the tissue. Signal strength is modified by properties of each proton's microenvironment, such as its mobility and the local homogeneity of the magnetic field. MR signal can be "weighted" to accentuate some properties and not others.
When an additional magnetic field is superimposed, one which is carefully varied in strength at different points in space, each point in space has a unique radio frequency at which the signal is received and transmitted. This makes constructing an image possible. It represents the spatial encoding of frequency, just like a piano. (example).

-
-
Signal in MR images is high or low (bright or dark), depending on the pulse sequence used, and the type of tissue in the image region of interest. The following is a general guide to how tissue appears on T1- or T2- weighted images.
- Dark on T1-weighted image:
- increased water, as in edema, tumor, infarction, inflammation, infection, hemorrhage (hyperacute or chronic)
- low proton density, calcification
- flow void
Bright on T1-weighted image:- fat
- subacute hemorrhage
- melanin
- protein-rich fluid
- slowly flowing blood
- paramagnetic substances: gadolinium, manganese, copper
- calcification (rarely)
- laminar necrosis of cerebral infarction
Bright on T2-weighted image:- increased water, as in edema, tumor, infarction, inflammation, infection, subdural collection
- methemoglobin (extracellular) in subacute hemorrhage
Dark on T2-weighted image:- low proton density, calcification, fibrous tissue
- paramagnetic substances: deoxyhemoglobin, methemoglobin (intracellular), iron, ferritin, hemosiderin, melanin
- protein-rich fluid
- flow void
- SPECT/PET (single photon/positron emission computed tomography) When radiolabeled compounds are injected in tracer amounts, their photon emissions can be detected much like x-rays in CT. The images made represent the accumulation of the labeled compound. The compound may reflect, for example, blood flow, oxygen or glucose metabolism, or dopamine transporter concentration. Often these images are shown with a color scale. (example)

Normal tissue
1. Bright means high signal intensity, dark means low, and interm. means intermediate.2. Bright means high density/high attenuation of x-rays, dark means low.3. Grey matter appears grey, white matter white.MR-T11 MR-T21 xray-CT2 dense bone dark dark bright air dark dark dark fat bright bright dark water dark bright dark brain "anatomic"3 interm. interm. Abnormal tissue
1. Blood brain barrier leak. For MR, gadolinium; for CT, iodinated contrast material.2. Unless very fresh or very old.3. Unless calcified.4. Often isodense.MR-T1 MR-T2 xray-CT enhancement1 infarct dark bright dark subacute bleed bright2 bright2 bright no tumor dark bright dark3 yes MS plaque dark bright dark4 acute
This guide is intended for teaching purposes only. (Additional information on MR signal in brain, or on basic principles of MR)
Interpretation of neuroimaging should be performed by qualified professionals.
'의학' 카테고리의 다른 글
| how evoution take place (0) | 2019.04.14 |
|---|---|
| cellular respiration (0) | 2019.04.13 |
| 청년 바보의사 안수현 2부 (0) | 2019.03.14 |
| 그 청년 바보의사'의 주인공 故 안수현 1부 (0) | 2019.03.14 |
| 원격의료 (0) | 2019.03.14 |